1. Programs
Note
- After the installation start from the terminal with the program nobocreatedb.py
- It is automatically checked whether the directory
~/.nobotouls/exists or not - If
~/.nobotouls/is not existing, the directoryconfigfrom the installation directory is copied to~/.nobotouls/ ~/.nobotouls/contains the skeleton of a nobotouls-sqlite3-database and a sample of an inputparameter file.- While running nobocreatedb.py for the first time,
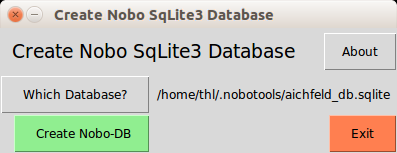
select (Button Which database?) the file
~/.nobotouls/aichfeld_db.sqlite. - Click Button Create Nobo-DB and create the tables
noborainandnoborawin the database. - Although you are free to chose your sqlite3-database it is recomendend to use ~/.nobotouls/aichfeld_db.sqlite as your standard database. Things will be easier.
- A template for the input parameter file can be found here: Inputparameter File
- Recommendation: start all programs from the terminal and get notice of the terminal output. Usefull information might be displayed.
1.1. Create and Feed the database
Programs to create and fill the database.
1.1.1. nobocreatedb.py
Creates a nobo sqlite3 database with the necessary empty tables:
nobostations: station datanoboraw: general meteorologic data (temperature, relative humidity, wind and pressure)noborain: 10 minutes rain data
1.1.2. noboraw2sqlite.py
Works for a whole directory with noboraw-files but crashes with erroneous files and stops further processing. Remove erroneous file and try again!
Select with a simple GUI inteface the NOBO sqlite database and select a directory with raw NOBO-csv-data files only(!). The NOBO-files will be fed into the data base. Please observe console output.
Yes: INSERT new and IGNORE existing records
No: INSERT new and REPLACE existing records.
1.1.3. noboraw2sqlite2.py
Similar to noboraw2sqlite.py but with the userinterface of noborain2sqlite.py (import only one file!).

1.1.4. noborain2sqlite.py
Reads raw nobo rain data file, sums them up, and converts them to 10 minute sums rain data, and writes it to noborain table of the sqlite3 database.

Note
Both, noboraw2sqlite2.py and noborain2sqlite.py
expect the database to be in the home directory at
~/.nobotouls/aichfeld_db.sqlite by default.
If the sqlite-db is placed elesewhere select it with the appropriate button.
1.2. Plot data
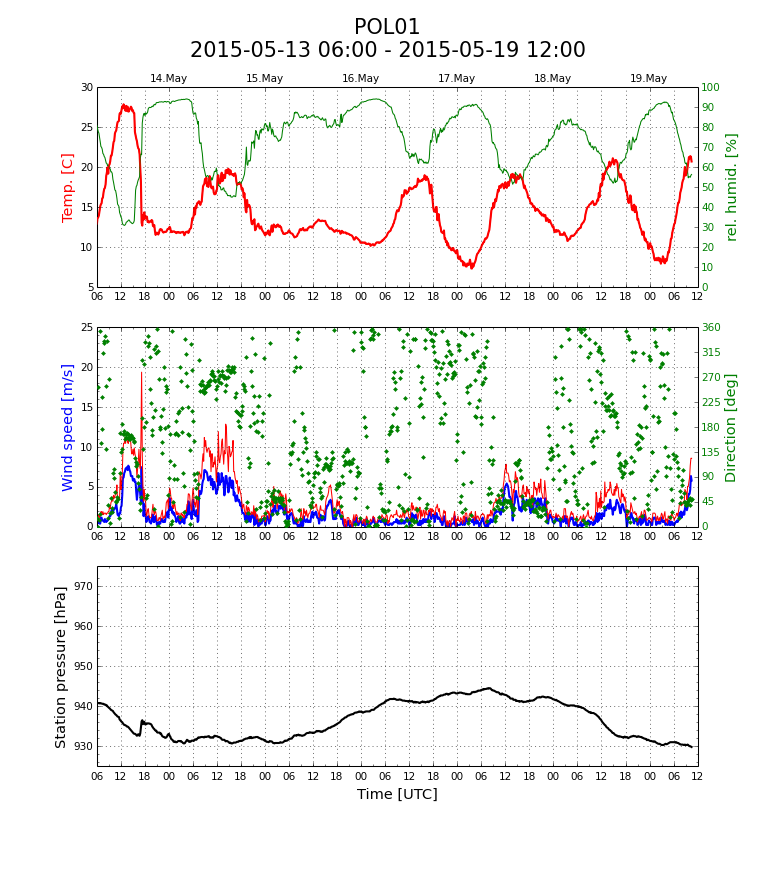
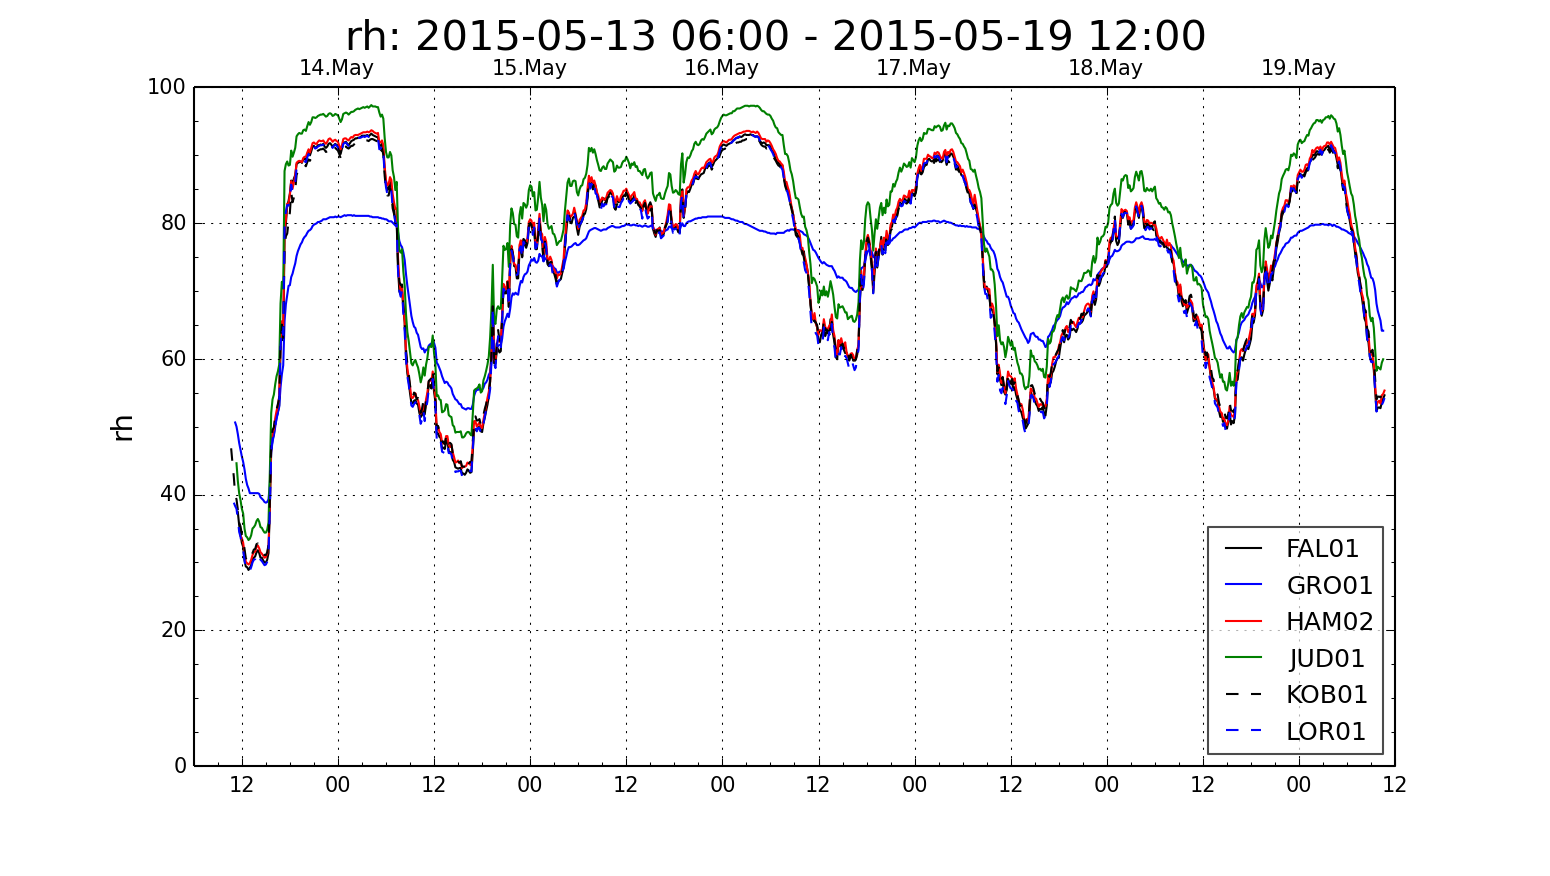
Meteograms of stations.
1.2.1. noboplot_1raw.py
Program that plots a complete single raw nobo file with a simple GUI interface. Please observe console output.
1.2.2. noboplot_alldb.py
usage: noboplot_alldb.py [-h] paramfile

Plot all nobo stations data files from sqlite-db within a given time window
defined in a separate parameter input file as parameter of the program.

Call: noboplot_alldb.py inputparams.dat

positional arguments:
    paramfile   Inputfile with all relevant input data.

optional arguments:
    -h, --help  show this help message and exit
1.2.3. noboplot_many21db.py
usage: noboplot_many21db.py [-h] [--dpi DPI] paramfile

Plot all nobo stations data files from sqlite-db within a given
time window defined in parameter input file.

Call: noboplot_many21.db inputparameter.dat

positional arguments:
    paramfile   Inputfile with all relevant input data.

optional arguments:
    -h, --help  show this help message and exit
    --dpi DPI   Set dpi of plot, default dpi=125
1.2.4. noboplot_allraindb.py
usage: noboplot_allraindb.py [-h] [--dpi DPI] paramfile

Plot all nobo RAIN stations data (table noborain) from sqlite-db within a
given time window defined in a separate parameter input file as parameter of
the program. Call: noboplot_allraindb.py inputparams.dat

positional arguments:
   paramfile   Inputfile with all relevant input data.

optional arguments:
   -h, --help  show this help message and exit
   --dpi DPI   dpi of output (pixel) graphic, defaults to 90
Relevant parameters in the parameter file paramfile:
# sqlite-database pathname
dbname;       /home/thl/nobotouls/data/nobodb/aichfeld_db.sqlite
# outputdirectory
outputdir;    /home/thl/nobotouls/test/outrain1
# start and end date and time as integer (yyyymoddhhmi)
startdattim;    201507010000
enddattim;      201507240200
# plotlimit for parameters
rr_lim; 0; 20
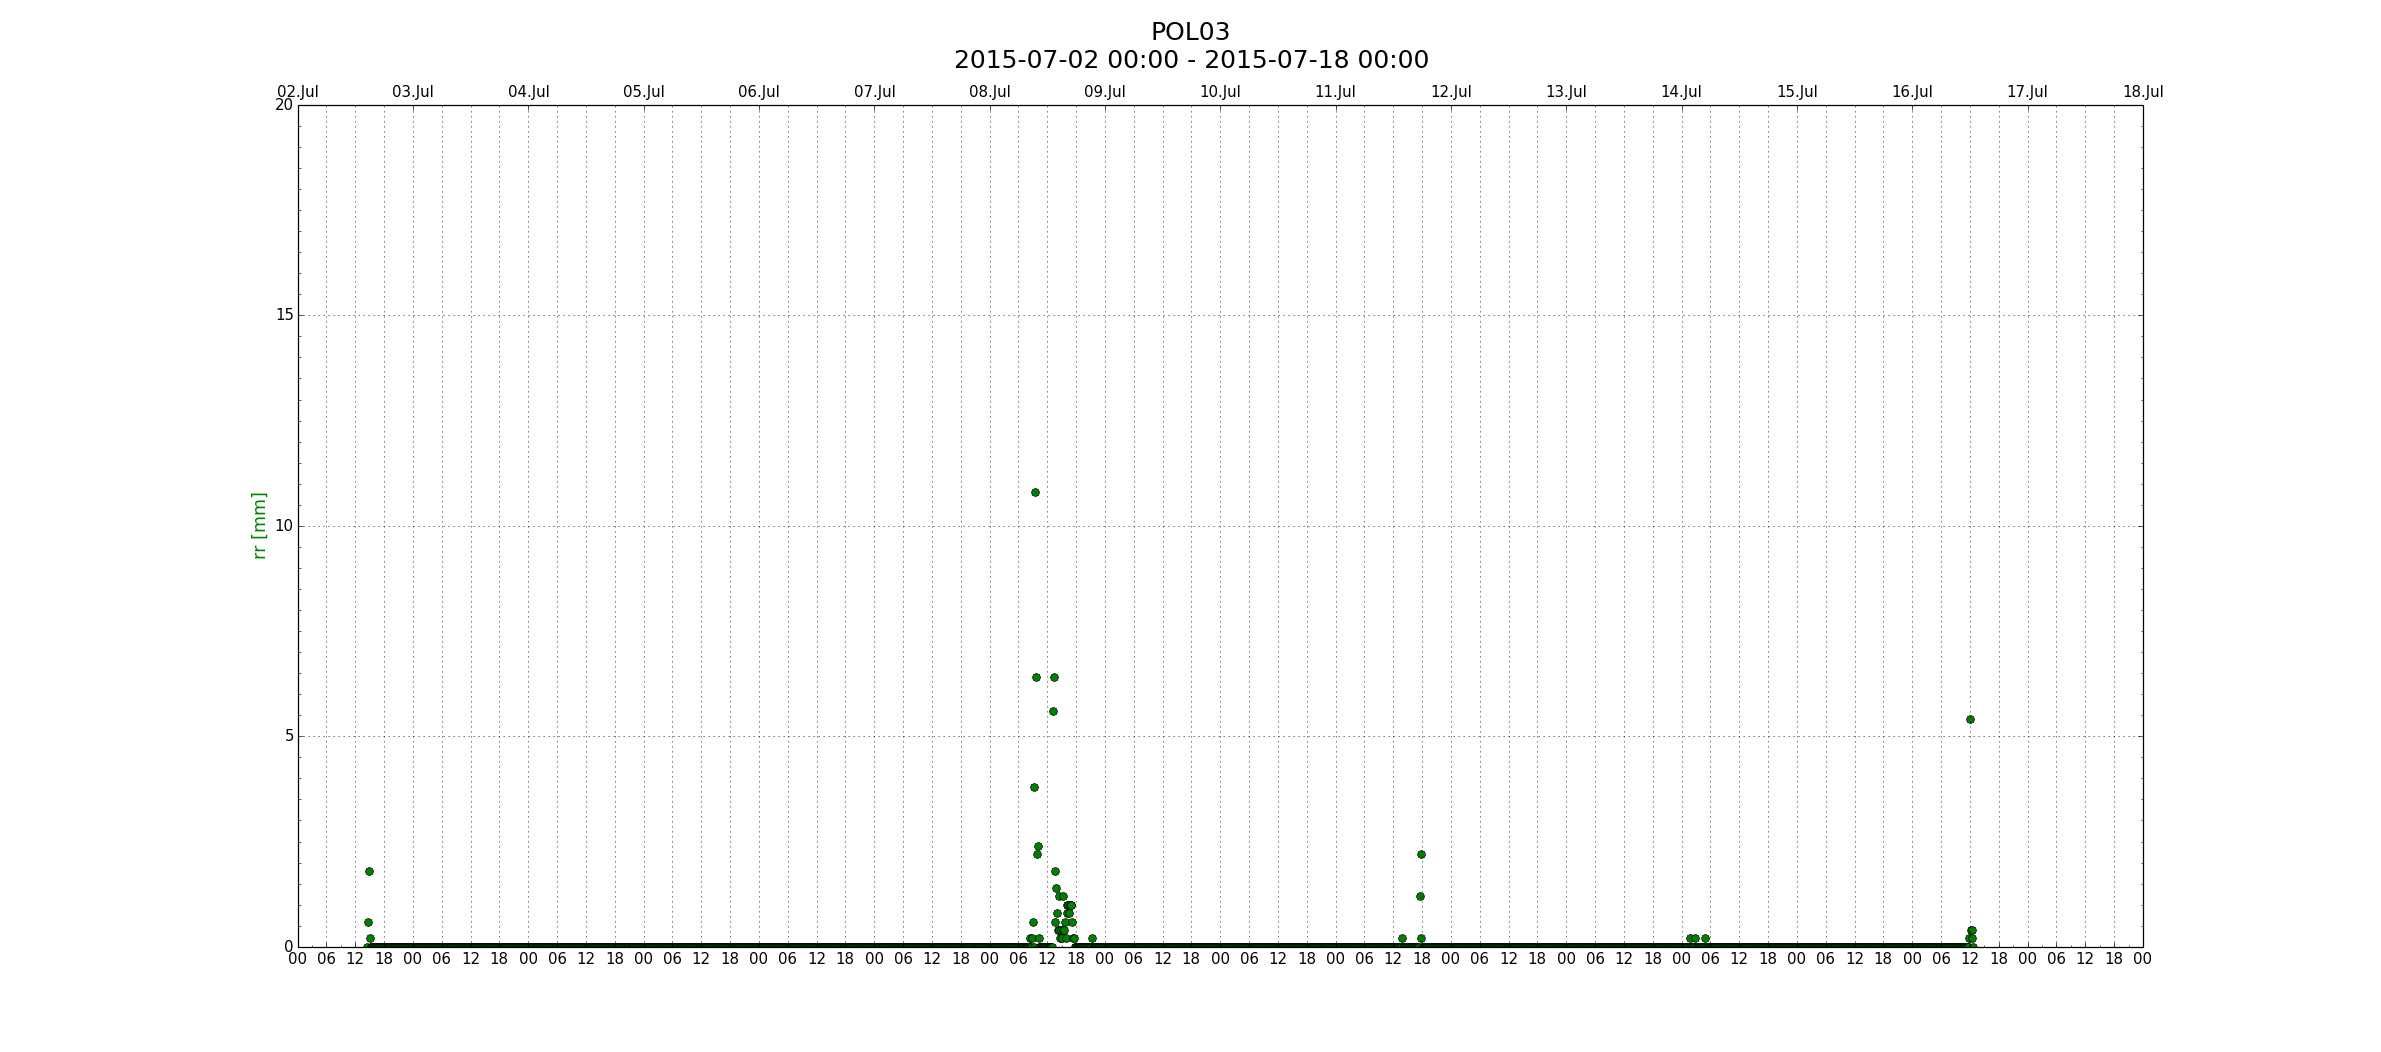
Periods with rain data are depicted with a green spot for every 10-minute time span (also zero rain is plotted!). If there are no rain data for a time intervall and station in the data base NOTHING is plotted.
1.3. Maps
Plot maps with wind data.
Note
Both programs, nobowindmap.py and
nobowindmap2.py need quite a long time to calculate the
map underlay. To avoid this repeated calculation at the first run
of both programs the resulting data object (dependent on the map
boundaries) is stored as a ‘python pickle’ in automatically named
files in the directory mappickledir defined in the
parameter file. Subsequent runs of the programs are therefore much
faster because they read the data from this pickle-file.
So do not change the pickle directory and do not delete the pickle file without need!
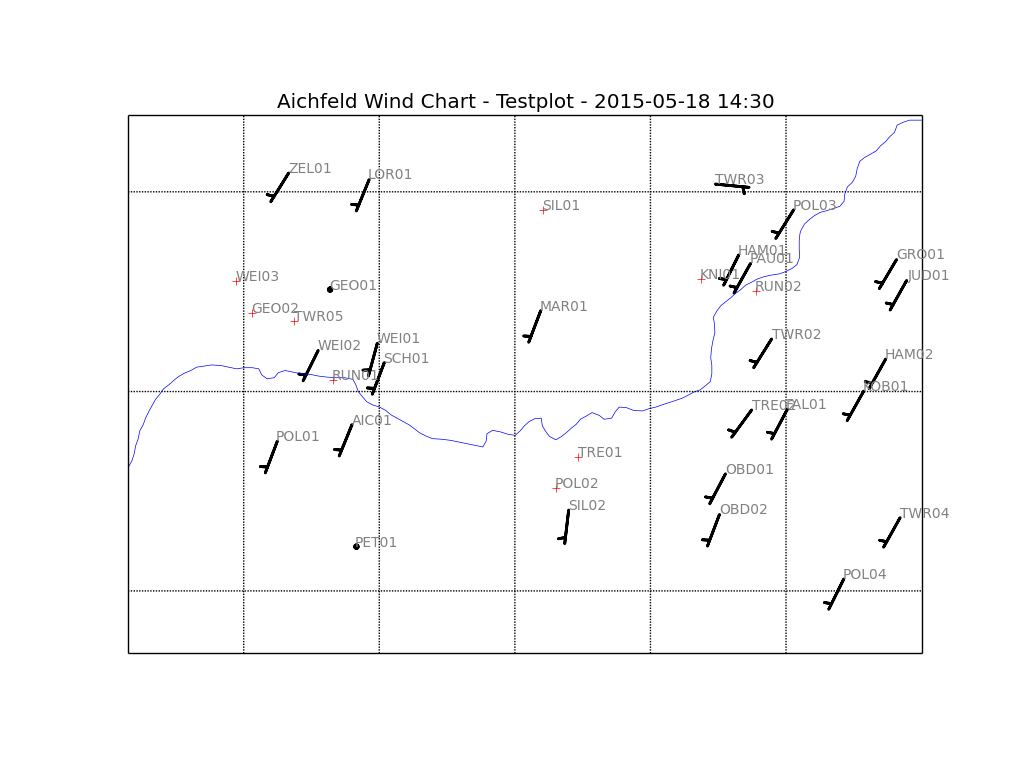
1.3.1. nobowindmap.py
Program nobowindmap.py
Version  0.1.0dev2015-06-28
(c) D.Thaler - dietmar.thaler(at)posteo(dot)org
MIT License - http://opensource.org/licenses/MIT

usage: nobowindmap.py [-h] [-m] [-k] [--version] paramfile

Plot a wind chart. Wind in knots. Wind barbs with the common interpretation
lower than 2.5 knots indicated without barns, calms are circles.
Input is read from a parameter file.

Necessary parameters:

* sqlite-database pathname: dbname

* outputdirectory: outputdir

* start and end date and time as integer (yyyymoddhhmi):
  startdattim , enddattim

* time-delta in minutes: timedelta

* Title of the map as ASCII-String (no Umlaute etc..): maptitle

* Map limits: max. longitude; min. latitude; max. latitude (deci. degrees):
  maplimits

* Map pickle directory:  mappickledir

optional arguments:
  -h, --help   show this help message and exit
  -m, --movie  If set it produces a movie and deletes the output images.
               Otherwise only images are produced without a movie
  -k, --keep   If set the images are also kept after a movie has been produced
  --version    show program's version number and exit
Example movie can be download with left click here.
Plot a wind chart. Wind in knots. Wind barbs with the common interpretation lower than 2.5 knots indicated without barns, calms are circles. Input is read from a parameter file.
Necessary parameters:
- sqlite-database pathname: dbname
- outputdirectory: outputdir
- start and end date and time as integer (yyyymoddhhmi): startdattim , enddattim
- time-delta in minutes: timedelta
- Title of the map as ASCII-String (no Umlaute etc..): maptitle
- Map limits: max. longitude; min. latitude; max. latitude (deci. degrees): maplimits
- Map pickle directory: mappickledir
1.3.2. nobowindmap2.py
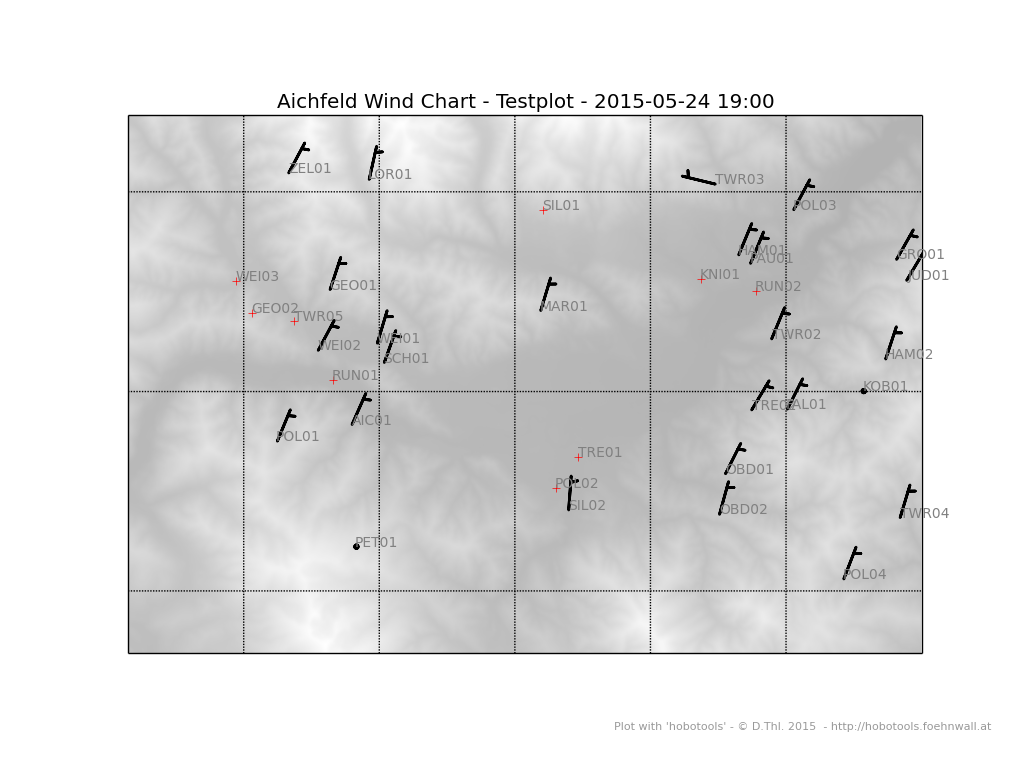
Like nobowindmap but with the use of a digital elevation data file to display orography as the background of the map.
Note
Download DEM-Data
- Required DEM-data can be found here: http://srtm.csi.cgiar.org/SELECTION/inputCoord.asp
- An appropriate DEM file for the AICHFELD-region is provided
here (157,7 MB!!; download with right click).
Program nobowindmap2.py
Version 0.0.5dev20161112
(c) D.Thaler - dietmar.thaler@posteo.at
    MIT License - http://opensource.org/licenses/MIT

    usage: nobowindmap2.py [-h] [-m] [-k] [--version] paramfile

    Plot a wind chart (wind in knots!). Input is read from a parameter file.
    VERSION 2: with HR-DEM-Dat Necessary parameters:

    * sqlite-database pathname: dbname

    * outputdirectory: outputdir

    * start and end date and time as integer
    (yyyymoddhhmi): startdattim , enddattim

    * time-delta in minutes: timedelta

    * Title of the map as ASCII-String (no Umlaute etc..): maptitle

    * Map limits: max. longitude; min. latitude; max. latitude
      (deci. degrees): maplimits

    * Map pickle directory: mappickledir

    * Path to HR-DEM data file: dempath

    positional arguments:

    paramfile    File with parameters for wind map plotting

    optional arguments:

    -h, --help   show this help message and exit
    -m, --movie  If set it produces a movie and deletes the output images.
                 Otherwise only images are produced without a movie
    -k, --keep   If set the images are also kept after a movie has been produced
    --version    show program's version number and exit
Plot a wind chart. Wind in knots. Wind barbs with the common interpretation lower than 2.5 knots indicated without barns, calms are circles. Input is read from a parameter file. - VERSION 2: with HR-DEM-Dat
Necessary parameters:
- sqlite-database pathname: dbname
- outputdirectory: outputdir
- start and end date and time as integer (yyyymoddhhmi): startdattim , enddattim
- time-delta in minutes: timedelta
- Title of the map as ASCII-String (no Umlaute etc..): maptitle
- Map limits: max. longitude; min. latitude; max. latitude (deci. degrees): maplimits
- Map pickle directory: mappickledir
- Path to HR-DEM data file: dempath
